Facts and graphs
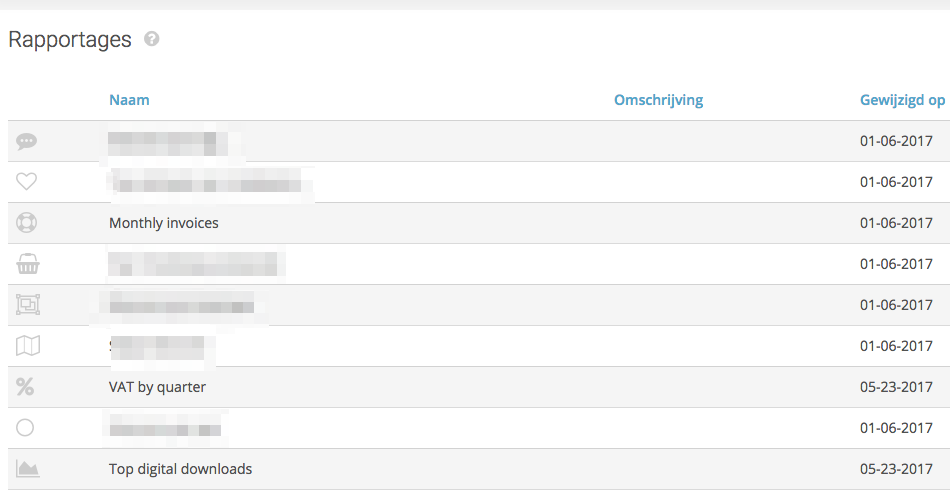
The tool Reports will help you to generate in an easy way all kinds of results and overviews/summary's of your company figures. You can keep track of all the facts and even make graphs. For instance: it is possible to generate a list of all the invoices per day, per month, per quarter, etc. It is also possible to generate the results of the best sales employee in the last month, or the status of the invoices. All the data from the CRM can be generated; the settings can be changed depending on your wishes. All the results can be shown in a listview, but also in a graph.

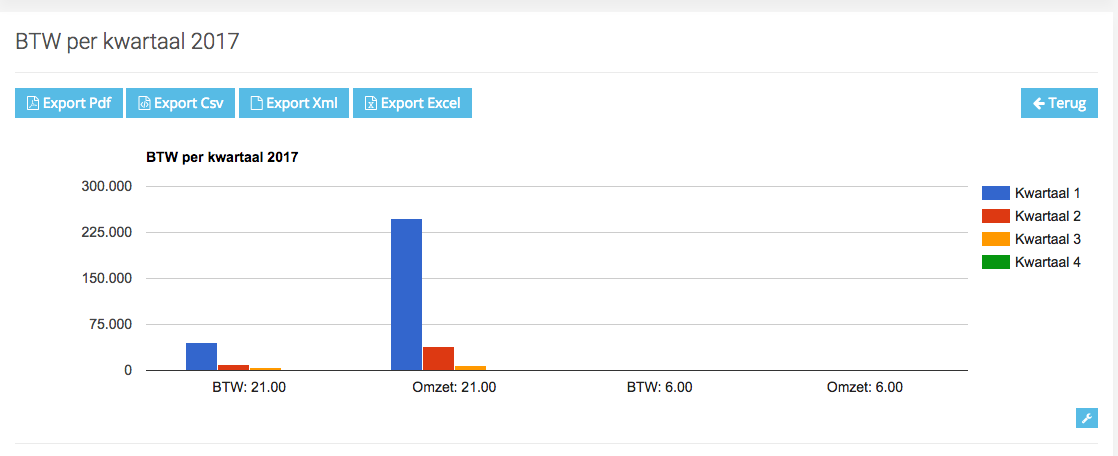
An example of a graph